Contact Channel Comparison
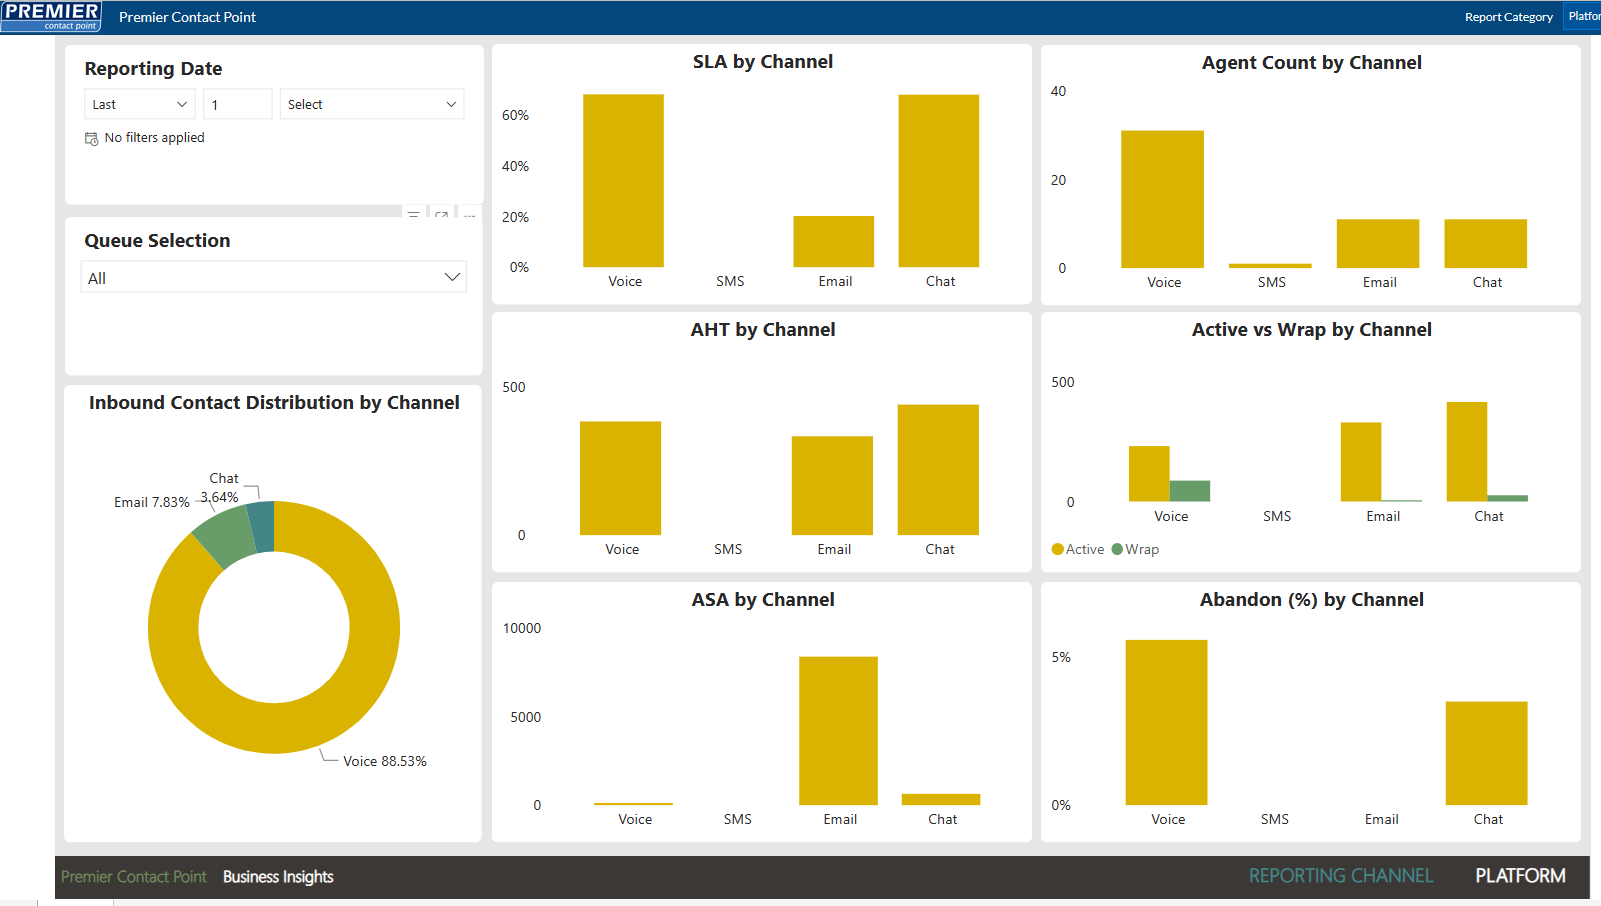
The Contact Channel Comparison gives an overview of various metrics for configured contact channels. It uses a console type styling to display pie and column charts.

Report Fields
The report contains the following fields.
| Field | Description |
|---|---|
| Inbound Contact Distribution by Channel | The Inbound Contact Distribution by Channel reports the percentage distribution of inbound contacts across the configured channels within the reporting period using a pie chart. |
| SLA by Channel | The SLA by Channel reports the percentage of contacts handled within service level answer time per channel type within the reporting period using a column chart. |
| Agent Count by Channel | The Agent Count by Channel reports the SLA’s per channel type within the reporting period using a column chart. ??????? |
| AHT by Channel | The AHT by Channel reports the average handle time per channel type within the reporting period using a column chart. |
| Active vs Wrap by Channel | The Active vs Wrap by Channel reports the percentage of average active time vs the average wrap time per channel type within the reporting period using a column chart. |
| ASA by Channel | The ASA by Channel reports the average speed of answer per channel type within the reporting period using a column chart. |
| Abandon (%) by Channel | The Abandon (%) by Channel reports the percentage of abandoned contacts per channel type within the reporting period using a column chart. |
Report Filters
The report contains the following inbuilt filters.
| Field | Description |
|---|---|
| Queue Selection | The Queue filter can be used to select one or more queues to report on. With the filter applied values in the report will be updated to reflect what was selected. |