One of the most frustrating issues that Contact Centre managers share with us is not being able to access key Contact Centre data in the way they need it displayed.
This is because the real-time and historical business reports that come standard with most vendor solutions are pre-configured, and inflexible. If you want to change display options, combine datasets, add different filters, or create reports that show datasets in a way that is more aligned to your organisational operations and requirements, then you’ll need to pay the vendor to create custom reports. This is not only expensive; it often takes months to be completed.
Reports from the world’s BI and analytics leader
We listened to these frustrations and did something about it. We looked to the world leader in BI and Analytics to ensure our Contact Centre clients have the best there is.
Our Contact Centre Business Insight suite uses Microsoft’s Power BI analytics and data visualisation tool. Power BI is a key reason behind Gartner positioning Microsoft as the Leader, in their 2017 Magic Quadrant for Business Intelligence and Analytics Platforms – the 10th consecutive year Microsoft has been positioned as a leader.
The Business Insight reports that come standard with Premier Contact Point (PCP) are infinitely flexible. You can quickly manipulate to your heart’s content – to get the data that means the most to you, displayed in a way that makes the most sense to you. The technology enables users to create custom visuals that are uniquely tailored to suit user needs, and to share these insights in real time.
Class leading real-time dashboards
As standard, PCP now includes easily configurable, stunning dashboards that will enable you to display the real-time measures that you want to present as well as the look and feel of those measures. Visual and audio alerts can be set by configurable thresholds, and external data can be brought into the dashboard canvas using URL hooks.
Powerful datasets that every contact centre needs
We’ve outlined here five useful ways you can use real-time and Business Insight reporting to significantly aid management, planning, and decision making within a Contact Centre.
1. Let team leaders manage in real time
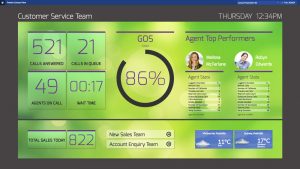
Display real-time reports on team leader dashboards and wallboards, to keep track minute by minute of the KPIs which are most important. Visually display calls and wait times in queues, top performers, sales tallies and any number of stats that you need to keep a close eye on.
This will ensure your team leaders are kept alerted to issues impacting key Contact Centre metrics, so they can take decisive action to bring performance back on track, and acknowledge and reward achievements.
Our dashboards and wallboards are easily customisable by supervisors to display the metrics they need, in the way they want them displayed.
2. Keep staff informed and motivated in real time
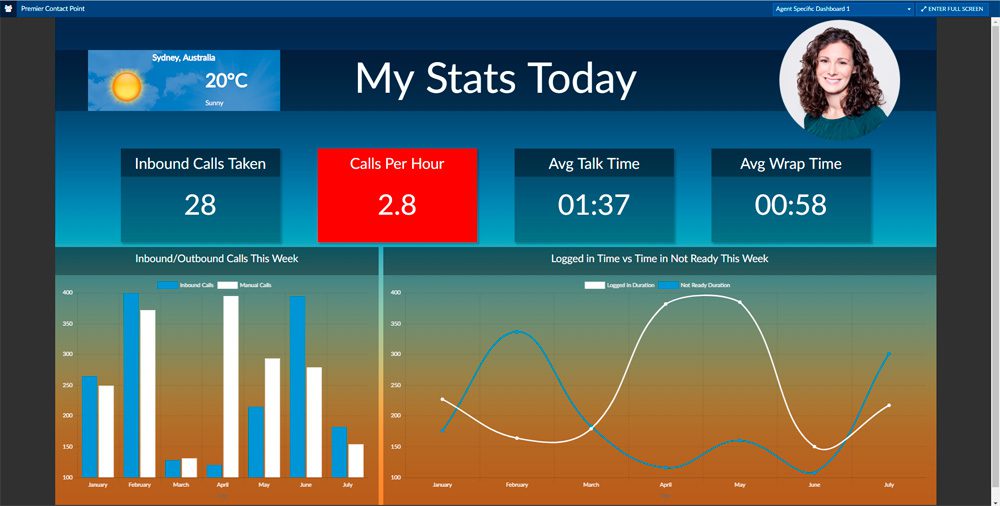
When your team members have goals to achieve, it’s helpful (and motivational) for them to see how they’re doing. Tiles can be configured to turn red if they’re falling below a pre-set KPI, alerting them (and the team leader) that something needs fixing. Maybe they’re taking too long to wrap calls, or maybe there aren’t enough calls to keep them busy and it’s time to switch them to another queue or task.
3. Manage sales campaigns in real time
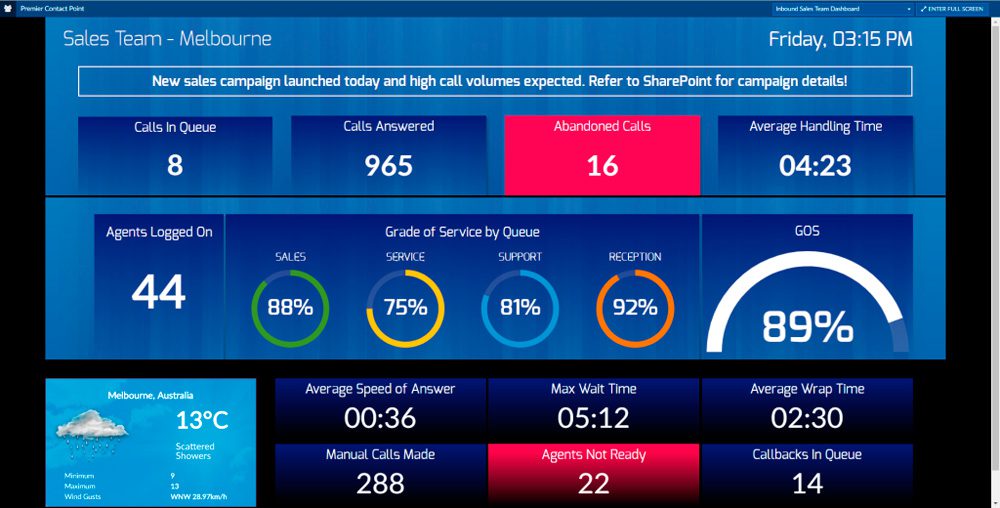
When the marketing department launches a new sales campaign, contact centre teams need to be ready for the onslaught. Dashboards and wallboards can easily be configured to display important metrics like Grade of Service by Queue, abandoned calls, AHT, callbacks in queue, wait times, and a whole lot more. Team leaders can configure dashboards to display the data that’s most meaningful to them, set KPIs and take decisive action when tiles turn red, requiring fast action. For example, if there’s a spike in abandoned calls and callbacks in the middle of a sales campaign, this could alert supervisors to divert more resources into handling the sales queue.
4. Review metrics post campaign and plan for the next one
Our BI reports have the flexibility to be combined with external data sources – like CRM datasets – to quickly build highly informative reports that display useful data in countless combinations.
- Reports could be combined to analyse call types, queue types, staffing and other important metrics to facilitate resource planning for the next campaign.
- Contact centre metrics could be combined with sales data and CRM data to provide insights into product popularity, best time of day for purchase, buyer demographics, method of contact (call, email, chat, etc) and a host of valuable insights to facilitate future campaign planning.
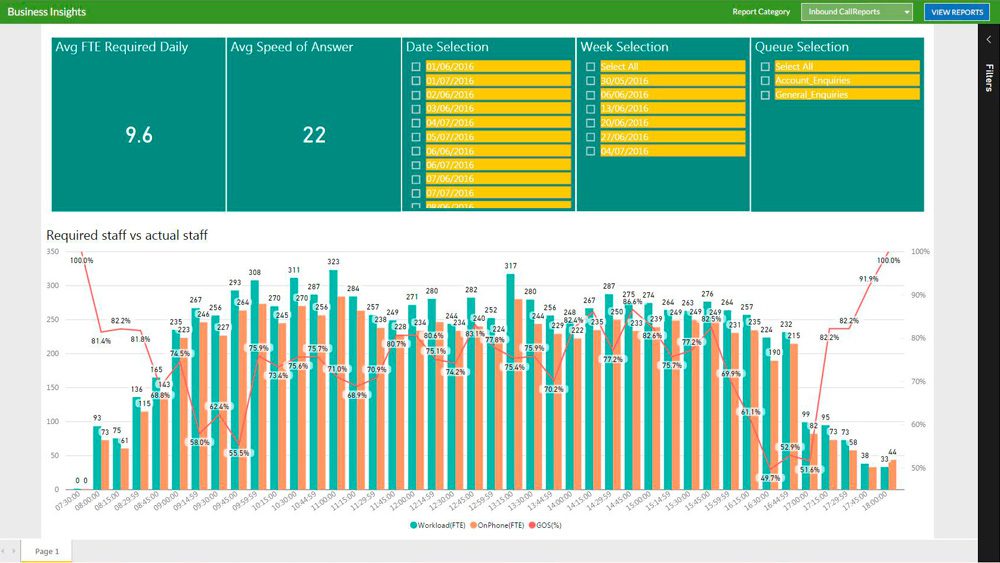
5. Use historical reports for planning, training and team scheduling
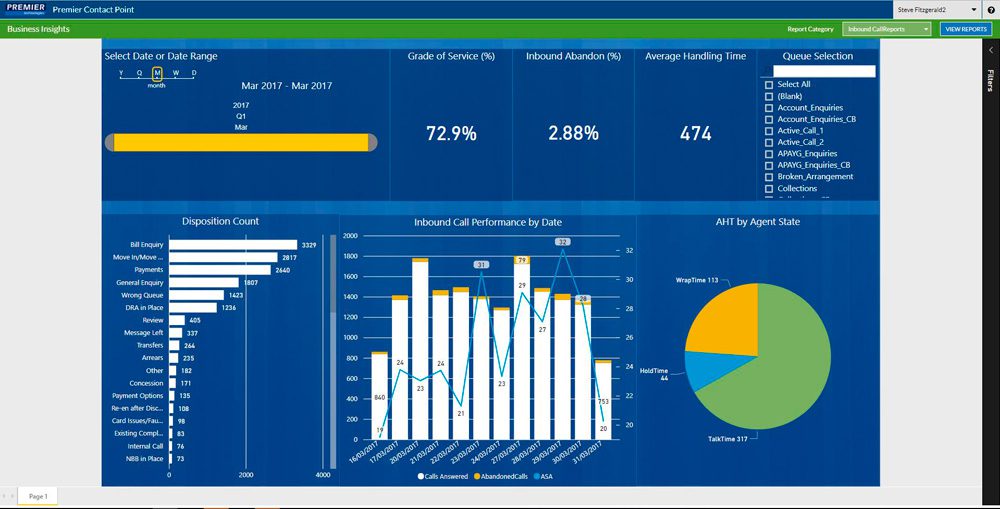
One of the most powerful functions of our BI reports is the ability to quickly filter and drill down into any report to display datasets in a variety of ways.
- Review staffing levels and KPI achievements. Easily drill down into deeper data – by time periods, by queue type, by Grade of Service – and plan future campaign or event staffing levels.
- Review staff performance by teams, by agents, by campaign and any number of KPIs. Combine this with an analysis of dispositions or Customer Satisfaction ratings to identify training needs.
Knowledge is power, as the old adage goes. It’s never been this easy to access powerful, organisational-wide, real-time and historical reports to help you make informed decisions to further your business.
And all this can be done without waiting for the IT Department to assist, or forking out significant amounts of money for customised rea-ltime or historical reports.
Powerful, Flexible Reports for Contact Centres
Premier Contact Point makes tracking progress, displaying KPIs, and planning for the future easy. Contact us to set up an obligation-free demo on how our beautiful and simple-to-use, customisable Dashboards and BI reports can help you achieve growth and optimise customer service in your Contact Centre .
